All published articles of this journal are available on ScienceDirect.

Association of Diagnosed Obstructive Sleep Apnea with Hospitalization and Mortality in a Retrospective New York City COVID-19 Surge Cohort with a Risk Prediction Model
Authors Info & Affiliations
Abstract
Background:
COVID-19 infection is more severe in patients with obstructive sleep apnea (OSA) with unclear modification by risk factors. Additionally, there is no scoring algorithm for probability of admission.
Methods:
On 8/4/2020 we queried New York City Health and Hospitals system database for patients above 15 years old who tested positive for COVID-19 during the surge. The target was diagnosed OSA. The timeframe was between 3/24/2020 and 6/7/2020 with limited elective hospital admissions. We calculated case-control-matched odds ratios for admission, intubation, and death. Additionally, we introduced a scoring system to predict the probability of admission due to COVID19 infection in the presence of OSA and other comorbidities.
Results:
Out of 19,593 COVID positive patients 306 (1.6%) had documented OSA. On multivariate analysis, the adjusted odds ratios for patients with OSA were 2.04 (CI 1.32-3.16, p 0.001) for admission, 1.05 (0.73-1.52, p 0.784) for intubation and 1.23 (CI 0.95-1.61, p 0.122) for mortality. After matching and comparing to a randomly selected non-OSA patients, the adjusted odds ratio for the same outcomes were 2.21 (1.41-3.46, p <0.001)-admission, 1.28 (0.83-1.98, p 0.256)-intubation and 1.69 (1.24-2.28, p<0.001)-mortality. Per our developed 11-point scoring algorithm, the risk of admission for these patients is almost 90% when the summation of points is as a low as 4 out of 11.
Conclusion:
Diagnosis of OSA is associated with hospital admission and mortality in COVID patients. This should be considered during triage and therapy decisions. Presented scoring model for estimated risk of admission could serve as a quantitative tool to estimate risk of admission.
1. INTRODUCTION
Risk factors overlap between obstructive sleep apnea (OSA) and severe COVID-19. The proportion of severe COVID-19 cases in relation to all COVID-19 cases is like the prevalence of OSA in the general population (5-10%). Male gender, age>50 years old, hypertension, and increased BMI are well-known risk factors for OSA [1-3]. These are very similar to the clinical characteristics of the severe form of COVID-19 disease that were outlined by Guan et al. [4], namely hypertension, male gender and age >50. High BMI is another well-known risk factor for OSA that can exacerbate COVID-19 infection. It has been shown that odds for patients with COVID-19 admitted to the ICU with BMI> 35kg/m2 were 7.36 (1.63-33.14) compared to BMI ≤ 35 [5, 6]. This demonstrates how high BMI is a shared risk factor between OSA and COVID-19. Hence, all the evidence raises this question: Can OSA independently cause progression to a severe form of COVID-19? Testing this in a large dataset where the distribution of confounders is random to allow for unbiased evaluation helps develop appropriate strategies for controlling COVID-19 infection in patients with OSA.
2. MATERIALS AND METHODS
New York City Health and Hospitals system database was queried on August 4, 2020. Therefore, we identified patients with OSA. The inclusion criteria were non-pregnancy and age above 15 years old. The timeframe was set from 3/24/2020 to 6/7/2020 because of limited elective admissions. Positive SARS-CoV-2 was a datapoint to explore. OSA effect was reviewed via calculating the odds ratio for admission and mortality within a queried period (unadjusted) and adjusted for comorbidities using logistic regression. A case-control matching model was established (1:5) for each COVID + patient with and without OSA diagnosis to match patients based on age, gender, hypertension and diabetes to adjust for comorbidities. Then, a multivariate analysis was performed. A lack of availability of BMI in non-admitted patients was a limiting factor.
BMI was recorded in 6438/7442 (86.5%) admitted and 1164/12151(9.6%) patients without admission; therefore was not used in the analysis.
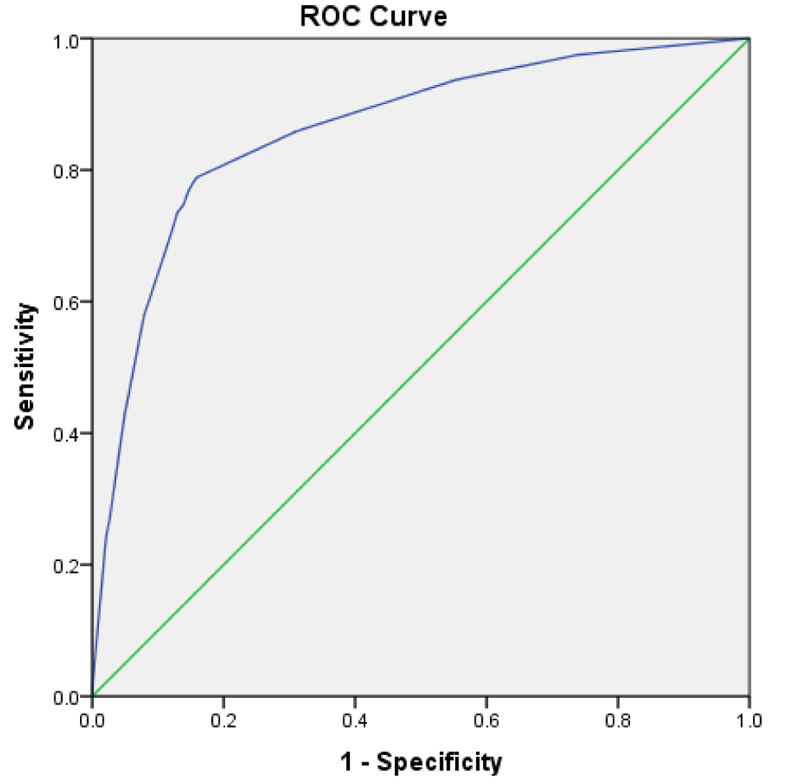
We could not participate in BMI in selecting the matched control group. However, we overcame this issue by recording the missing values in BMI and making a separate category with them. This way, we allowed BMI to participate in the multivariate testing. Last, we created a scoring system with the identified risk factors and their weights. This way, we were able to present the calculated risk for admission. We selected the admission outcome for calculating the probabilities because OSA showed a statistically significant difference in both the general and matched data. The table of risk estimation was constructed regardless of BMI because it was not available in all data. The ROC curve indicates the validity with an area-under-curve of 0.861. This model was constructed based on the work of Sullivan et al., which comprises creating a logistic regression with the risk factors, fitting the equation, determining specific points for each risk factor and rounding them to the nearest integer [7].
3. RESULTS
Out of 19,593 SARS-CoV-2 positive patients 306 (1.6%) had documented OSA, 6,906 (35.2%) hypertension, 4688 (23.9%) diabetes, and 10,417 (53.2%) were male; 7,442 (38%) were admitted, 913 (4.7%) intubated and 2,722 (13.9%) died (Table 1). Unadjusted odds ratio (95% CI) for patients with OSA for hospital admission, intubation, and death were 10.6 (7.6-14.7), 3.0 (2.1-4.2), and 3.6 (2.8-4.5). The logistic regression, which was adjusted for sex, age, hypertension, diabetes, and BMI>35, presented the odds ratio of OSA as follows: admission 2.040 (1.316-3.164), 1.052 (0.729-1.522) and mortality 1.232 (0.946-1.606). Once the logistic regression testing was repeated for the matched group (n=1,836), OSA was a predictor for both admission (OR 2.209, p 0.001) and mortality (OR 1.687, p 0.001). The OSA did not predict the need for intubation in all data and the matched dataset (Table 2). The risk prediction model developed via regressing admission based on the regressor such as OSA, diabetes, hypertension, male gender and age >50. (Table 3). The calculated points in an 11-point system are listed in Table 4. Table 5 depicts the calculated risk of admission from a minimum of 1 point to a maximum of 11 points. The point for OSA is 2, with an estimated risk of admission as high as 75.3%, escalating to 83.6% when there is just one extra point (Table 5). Fig. (1) is the ROC for discriminating ability of the OSA risk of an admission prediction model with the area-under-curve 0.861.
4. DISCUSSION
OSA and the pulmonary manifestation of COVID-19 are common in several aspects. Guan et al. presented high and statistically significant odds ratios for many risk factors shared between OSA and severe COVID-19 infection [4]. Their sample size consisted of 1099 COVID-19 patients (173 severe). The unadjusted odds ratio they reported was 6.2 (95% CI 3.3-11.8) for age >50 years old, 1.7 (0.99-2.8) for the male gender and 3.3 (1.96-2.8) for hypertension. BMI>35 is another contributory risk factor for both OSA and COVID-19 that has been documented [5, 6].
| - |
OSA Diagnosed |
OSA Not Diagnosed | p-value |
|---|---|---|---|
| N=306 | N=19,287 | ||
| Age, mean (SD) | 58 (13) | 54 (17) | <0.001 |
| Age>50 | 231 (75.5%) | 11,072 (57.4%) | <0.001 |
| Gender, male | 173 (56.5%) | 10,244 (53.1%) | 0.23 |
| Hypertension | 262 (85.6%) | 6,644 (34.4%) | <0.001 |
| Diabetes | 186 (60.8%) | 4,502 (23.3%) | <0.001 |
| Admitted | 264 (86.3%) | 7,178 (37.2%) | <0.001 |
| Intubation | 38 (12.4%) | 875 (4.5%) | <0.001 |
| Deceased | 110 (35.9%) | 2,612 (13.5%) | <0.001 |
| BMI | 39.5±10.6 | 29.0±7.0 | P<0.001 |
| All Data (n=19,593) | Matched Data (n=1,836) | |||||||
|---|---|---|---|---|---|---|---|---|
| OR | P-value | CI Lower | CI Upper | OR | p-value | CI Lower | CI Upper | |
| Admission | 2.040 | 0.001 | 1.316 | 3.164 | 2.209 | 0.001 | 1.408 | 3.464 |
| Intubation | 1.052 | 0.784 | 0.729 | 1.522 | 1.284 | 0.256 | 0.834 | 1.979 |
| Mortality | 1.232 | 0.122 | 0.946 | 1.606 | 1.687 | 0.001 | 1.246 | 2.284 |
| Odds Ratio | Std. Err. | P value | CI Lower | CI Upper | |
|---|---|---|---|---|---|
| OSA | 3.520 | 0.674 | <0.001 | 2.419 | 5.124 |
| Hypertension | 8.681 | 0.375 | <0.001 | 7.976 | 9.448 |
| Diabetes | 3.861 | 0.186 | <0.001 | 3.512 | 4.244 |
| Gender, male | 2.137 | 0.084 | <0.001 | 1.979 | 2.308 |
| Age>50 | 1.669 | 0.071 | <0.001 | 1.537 | 1.814 |
| Constant | 0.088 | 0.004 | <0.001 | 0.081 | 0.096 |
B) Fit the equation and point each risk factor according to Sullivan et al. This results in a 11-point risk prediction model-Table 5
C) Construct table of probabilities for admission based on total scores
| Risk Factor | Points |
|---|---|
| Age> 50 | 1 |
| Gender, male | 1 |
| OSA | 2 |
| Diabetes | 3 |
| Hypertension | 4 |
| Total points | 11 |
| Total Points | Estimated Risk (%) |
|---|---|
| 1 | 64.6 |
| 2 | 75.3 |
| 3 | 83.6 |
| 4 | 89.5 |
| 5 | 93.4 |
| 6 | 95.9 |
| 7 | 97.5 |
| 8 | 98.5 |
| 9 | 99.1 |
| 10 | 99.5 |
| 11 | 99.7 |
Many observations point to the possible worsening mechanism in OSA patients. Nasopharyngeal viral particles can be aerosolized by snoring during obstructive hypopneas by the turbulent flow. This aerosol pulmonary delivery would increase during high tidal breaths following obstructive or mixed apneas. In-vivo studies of time course and extent of the naso-pulmonary virus translocation are lacking. According to the drug and vaccine pulmonary delivery studies, it is known that naso-pulmonary aerosol delivery depends on particle size and inspiratory flows. Up to 32% of nasally introduced aerosol can be delivered into the dependent portions of the lung at high inspiratory flows-Wallin [8]. Thus, a higher degree of naso-pulmonary viral translocation during an early stage may hasten COVID-19 progression in patients with OSA. Therefore, we concur with Baker et al. recommendation to continue CPAP therapy in admitted OSA patients with concomitant COVID-19 [9]. A non-vented mask or helmet interface with in-circuit viral filters can be employed for this purpose. Patient pruning can not only alleviate hypoxemia that is caused by COVID-19 pneumonia but also decrease naso-pulmonary viral transfer. Apart from CPAP and positional therapy, other approaches, including sleep hygiene and oral appliances, might alleviate OSA and thus decrease the risk of COVID-19 progression in OSA patients [2]. The result of the Coronavirus SARS-CoV-2 and Diabetes Outcomes (CORONADO) study links OSA treatment with death from COVID-19 [10].
Mass et al. defined disease severity as needing hospitalization and developing respiratory failure. Their data was adjusted for diabetes, hypertension, and BMI. Then, they discovered patients with OSA to be at high risk. Additionally, they learned that OSA is a risk factor for getting COVID-19 infection more than OSA-free patients. So, they demonstrated both predisposing and exacerbating effects for OSA [11].
Their finding was similar to Strausz et al. research [12]. Najafi et al. showed a contributory relation between risk factors such as the severity of OSA, untreated OSA and contracting COVID-19 infection. They supported the rationale by discussing the proinflammatory effect of OSA [13].
Our study is powered by a large sample size (19,593) obtained from a major site of the COVID pandemic. Another methodology that supports the validity of the results is selecting a control group matched for co-morbidities. We learned that in a matched dataset, the chance of admission from COVID-19 infection in the presence of OSA is greater than the control group (OR 2.209, CI 1.409-3.464). At the same time, there is a 68% more chance of death (OR 1.687, CI 1.246-2.284). Our data and analysis were consistent with the findings from other authors [1-3]. However, other studies just reported odds ratios. In this analysis powered by a large sample size from the community, we demonstrated the role of OSA in COVID exacerbation by reporting odds ratios and developing an 11-point scoring system. This enables us to calculate the estimated risk of admission of an OSA + COVID-19 patient. In this scoring system, the point for OSA was 2, and the estimated risk of admission for a total of 1 point was 64.6%. Per this developed scoring algorithm, the probability of admission is almost 90% when the scores for the presenting risk factors are as low as 4. The total applicable score is 11, which shows how COVID-19 infection can evolve to its severe from OSA, and its risk factors (Table 4). The final area-under-curve calculation showed a good prediction ability of the scoring system (0.861) (Fig. 1).
BMI was available only for the admitted patients. So, we were not able to utilize it in the construction of the 11-point scoring system. As such, it was created without BMI. Nevertheless, we let the BMI participate in calculating odds ratios with a statistical adjustment described in the methods (Table 2).
CONCLUSION
OSA is associated with hospital admission and mortality in SARS-CoV-2 positive patients after adjusting for age, sex, and co-morbidities. This should be considered during triage and therapy decisions in the strained resources setting. The risk of admission quickly increases when there is COVID infection in the context of OSA and other co-morbidities. When the total point is 5 out of 11, the risk of admission is > 90%. The presented risk of admission model could serve as a quantitative historical baseline to monitor the effectiveness of the immunization and the spread of the new viral variants.
Our finding that patients with OSA are more likely to be hospitalized and succumb to COVID-19 in the surge setting justifies the allocation of additional resources to this vulnerable population, including early access to the vaccine, immunoglobulin therapy and triage to the higher acuity setting.
We acknowledge several limiting factors in this study that we need to mention. A lack of availability of BMI for all patients was a limiting factor. Therefore, we were not able to fully address the effect of obesity.
OSA diagnosis was present in 1.6% of SARS-Cov-2 positive patients, less than OSA prevalence in the general population. Franklin et al. calculated a mean of 22% for OSA in their systematic review using a clinical definition for OSA [14]. Given that the rate of OSA in the present study is determined from the medical record rather than the sleep study, it is expected to be underestimated. Probably, it was because of poor documentation at the time of the COVID surge. Therefore, the findings are more relevant to clinical practice, demonstrating increased risk in the documented OSA patients.
We did not have the data on the -hypopnea index and CPAP compliance; therefore, we could not address whether the severity of OSA or its treatment impacts COVID-19 outcomes.
The biological mechanism of COVID-19 progression independent from the comorbidities in the OSA patients could not be elucidated in this study.
LIST OF ABBREVIATION
| OSA | = Obstructive Sleep Apnea |
ETHICS APPROVAL AND CONSENT TO PARTICIPATE
Not applicable.
HUMAN AND ANIMAL RIGHTS
Not applicable.
CONSENT FOR PUBLICATION
Not applicable.
AVAILABILITY OF DATA AND MATERIALS
The data supporting the findings of the article is available within the article.
FUNDING
None.
CONFLICT OF INTEREST
The authors declare no conflict of interest, financial or otherwise.
ACKNOWLEDGEMENTS
Declared none.