All published articles of this journal are available on ScienceDirect.

Higher Scores of Ambient Temperature, Sunshine Hours and UV Index are Associated with Lower COVID-19 Mortality
Abstract
Background:
Following two years of the COVID-19 pandemic, thousands of deaths were registered around the world. A question on whether climate parameters in each country could or not affect coronavirus incidence and COVID-19 death toll is under debate.
Objective:
In this work, we aimed to analyse possible relation between the prevalence of COVID-19 deaths and the geographic latitude. The study focused on the geographic latitudes and some of their associated climate factors, such as the average annual level of temperature, sunshine hours and UV index.
Methods:
We sought the number of the deaths caused by COVID-19 in 39 countries. Latitude levels were plotted against the average annual levels of either temperature, sunshine hours or UV index. Data were analysed by simple linear regression or polynomial regression, by means of Microsoft Excel software (2016).
Results:
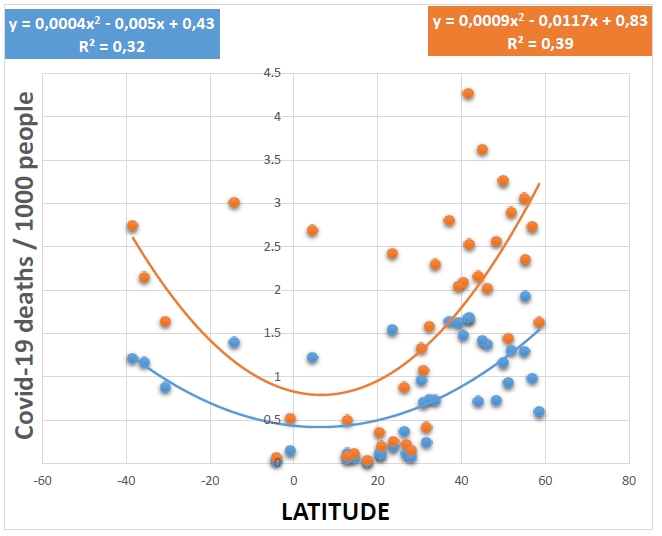
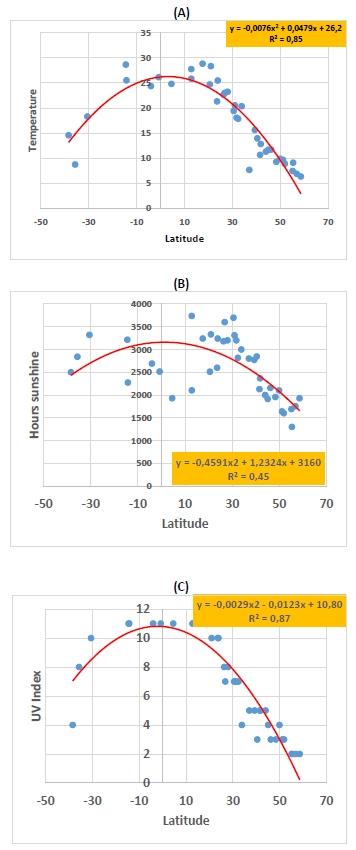
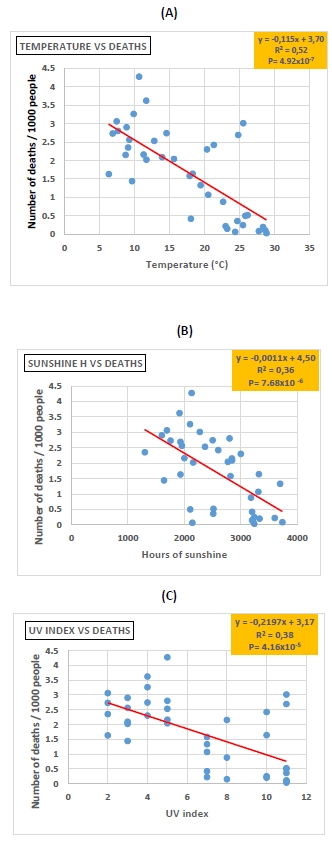
When COVID-19 death numbers were plotted against geographic latitudes, we obtained inverted bell-shaped curves, for both the first and second year of the pandemic, with a coefficient of determination of (R2 = 0,32) and (R2 = 0,39), respectively. In addition, COVID-19 death numbers were very negatively correlated with the average annual levels of temperature (R2 = 0,52, P= 4.92x10⁻⁷), sunshine hours (R2 = 0,36, P= 7.68x10⁻⁶) and UV index (R2 = 0,38, P= 4.16x10⁻⁵). Bell-shaped curves were obtained when latitude was plotted against the average annual number of temperature, sunshine hours and UV index, with a coefficient of determination of (R2 = 0,85), (R2 = 0,452) and (R2 = 0,87), respectively.
Conclusion:
In contrast to high-latitude countries, countries located at low latitudes may have suffered less COVID-19 death tolls, thanks to their elevated temperature, sunshine hours and UV index. The above climate factors, in addition to yet unknown factors, could have impaired the spread of the coronavirus and/or helped individual’s natural immunity to fight COVID-19 disease.
1. INTRODUCTION
The COVID-19 pandemic was declared two years ago following high death tolls caused by SARS-CoV-2 infections around the world [1]. The virus and its target human cell receptor ACE-2 were identified [2, 3]. SARS-CoV-2-infected people can experience mild to moderate symptoms, such as muscle pain, headaches, loss of smell and taste, diarrhea, and more severe symptoms, such as breathing difficulties. Thanks to a better understanding of the pathophysiology of COVID-19 [4-8], a breakthrough was achieved in the therapeutic management of COVID-19 patients, which was mainly based on prophylactic treatments with drugs such as anti-inflammatory corticoids, antibiotics, and blood thinners against inflammatory conditions (cytokine storm), infections and microcoagulations, respectively [9, 10]. Other adjuvant treatments [11-13] were used as well, such as immune-boosting vitamins (vitamin C, vitamin D), minerals (Zinc and magnesium) and probiotics/prebiotics products.
Several countries in Europe (mainly the United Kingdom, Spain, Italy, and France), and later in America, have suffered the highest numbers of deaths caused by COVID-19. Elderly people, obese and chronic disease-affected patients were the most affected. Since the beginning of the pandemic, researchers have been interested in whether or not climate parameters may play a role in the occurrence of the coronavirus disease. Several studies have pointed out a negative relationship between ambient temperature and coronavirus incidence and/or COVID-19 [14-18]. A recent study has classified COVID-19 as a possible seasonal low-temperature infection [19]. As a virucidal agent, UV light has been reported in many studies to have played a key role in the low prevalence of SARS-CoV-2 incidence and COVID-19 deaths in several countries [20-28].
The low incidence of COVID-19 mortality in many countries of Africa compared to those of Europe and America caught our attention. On the other hand, death tolls caused by COVID-19 in countries of North Africa were somehow higher than those registered in countries of central Africa. The purpose of the present study was to investigate possible relations between climate factors (ambient temperature, sunshine hours, and UV index) and COVID-19 mortality.
2. MATERIALS AND METHODS
We obtained COVID-19 death numbers for the 39 countries in the present study from specialized websites [29, 30]. For each country of the study, the number of deaths for the first year was considered from the start of the pandemic until March 25, 2021. While the number of deaths for the second year was calculated for the period up to February 20, 2022. The climate parameters were obtained from the web pages of several specialized institutions [31-34]. The data, correlation parameters, linear and polynomial regression, and figures were processed and analysed by the Microsoft Office Excel software (2016). The data and records were carried out according to the STROBE guidelines [35].
3. RESULTS
The 39 countries of the study are depicted in Fig. (1), and are distributed across both hemisphers as follows: North America (the United States and Mexico), South America (Brazil, Colombia, Argentina, and Chile), Europe (France, Italy, Spain, Germany, Portugal, the United Kingdom, Estonia, Lithuania, Croacia, Serbia, Poland, Romania, North Macedonia, Latvia, and Ukraine), Africa (Morocco, Argelia, Mauritania, Tunisia, Egypt, Sudan, Congo, Senegal, South Africa, Mali, and Libya), and Asia (Israel, Saudi Arabia, India). The population of the above countries is a sample of 3525 million people; 44.43 percent of the total world population. As shown in Fig. (1), 32 of the above countries are located in the northern hemisphere (2887 million people, representing 82% of our sample population), where around 90% of the world’s population lives. As depicted in Table 1, African countries and some Asian countries have registered the lowest death tolls in both the first and second years of the pandemic. Instead, countries in Western Europe and America have reported the highest death tolls.

| Country | Deaths at Year1 | Deaths at Year 2 | MAT | AAHSS | AAUVI |
| USA | 1,64 | 2,8 | 7,63 | 2800 | 5 |
| Mexico | 1,54 | 2,42 | 21,31 | 2600 | 10 |
| Colombia | 1,22 | 2,69 | 24,79 | 1930 | 11 |
| Chile | 1,17 | 2,15 | 8,71 | 2841 | 8 |
| Argentina | 1,21 | 2,74 | 14,55 | 2500 | 4 |
| Brazil | 1,4 | 3,01 | 25,51 | 2273 | 11 |
| Senegal | 0,06 | 0,11 | 28,65 | 3214 | 11 |
| South Africa | 0,881 | 1,64 | 18,28 | 3320 | 10 |
| Mali | 0,018 | 0,034 | 28,83 | 3239 | 11 |
| Egypt | 0,11 | 0,22 | 23 | 3600 | 7 |
| Sudan | 0,045 | 0,085 | 27,74 | 3737 | 11 |
| Congo | 0,024 | 0,066 | 24,36 | 2141 | 11 |
| Morocco | 0,24 | 0,42 | 18,04 | 3200 | 7 |
| Algeria | 0,07 | 0,15 | 23,22 | 3200 | 8 |
| Tunisia | 0,73 | 2,3 | 20,34 | 3000 | 4 |
| Libya | 0,37 | 0,88 | 22,64 | 3180 | 8 |
| Mauritania | 0,098 | 0,2 | 28,34 | 3332 | 10 |
| Israel | 0,7 | 1,07 | 20,51 | 3310 | 7 |
| Iran | 0,737 | 1,58 | 17,86 | 2817 | 7 |
| Philippine | 0,118 | 0,5 | 25,82 | 2103 | 11 |
| Saudia Arabia | 0,19 | 0,25 | 25,47 | 3240 | 10 |
| India | 0,11 | 0,36 | 24,68 | 2512 | 11 |
| Indonisia | 0,145 | 0,52 | 26,14 | 2515 | 11 |
| Jordan | 0,959 | 1,33 | 19,42 | 3697 | 7 |
| United Kingdom | 1,93 | 2,35 | 9,07 | 1300 | 2 |
| Italy | 1,68 | 2,53 | 12,8 | 2365 | 5 |
| France | 1,37 | 2,02 | 11,69 | 2156 | 3 |
| Spain | 1,48 | 2,09 | 13,93 | 2845 | 3 |
| Germany | 0,93 | 1,44 | 9,63 | 1640 | 3 |
| Portugal | 1,62 | 2,04 | 15,62 | 2770 | 5 |
| Estonia | 0,594 | 1,63 | 6,31 | 1930 | 2 |
| Lihtuania | 1,293 | 3,06 | 7,43 | 1691 | 2 |
| Macedonia N | 1,667 | 4,27 | 10,64 | 2128 | 5 |
| Croacia | 1,414 | 3,62 | 11,66 | 1913 | 4 |
| Serbia | 0,718 | 2,16 | 11,28 | 2000 | 5 |
| Latvia | 0,978 | 2,73 | 6,86 | 1754 | 2 |
| Ukraine | 0,725 | 2,56 | 9,25 | 1955 | 3 |
| Romania | 1,161 | 3,26 | 9,86 | 2100 | 4 |
| Poland | 1,304 | 2,9 | 8,85 | 1600 | 3 |
Inverted bell-shaped curves were obtained when geographic latitudes were plotted against COVID-19 death numbers, and thus, for both the first (R2 = 0,32) and second (R2 = 0,39) years of the pandemic, respectively (Fig. 2). In contrast, bell-shaped curves were obtained when latitude of each country was plotted against the average annual level of temperature (R2 = 0,85), sunshine hours (R2 = 0,45) and UV index (R2 = 0,87), respectively (Fig. 3), A through C). In addition, COVID-19 death numbers in the 39 countries of the study were very negatively correlated with the average annual levels of temperature (R2 = 0,52, P= 4.92x10⁻⁷), sunshine hours (R2 = 0,43, P= 7.68x10⁻⁶) and UV index (R2 = 0,38, P= 4.16x10⁻⁵) (Fig. 4), A through C).
4. DISCUSSION
In the present observational study, attention was paid to the difference in COVID-19 mortality between populations across the world. The data on COVID-19 mortality clearly shows that during the two-year pandemic period, there were always higher scores of COVID-19 mortality in Europe and America compared to African and Asian countries. The correlations that were found between COVID-19 death tolls and climate factors support previous studies that pointed out the possible impact of climate on the coronavirus incidence and/or mortality caused by COVID-19 [14-19]. In north Africa, some countries like Morocco seem to have an intermediary pandemic situation between Africa and Europe because the death numbers caused by COVID-19 in Morocco were lower than those registered in neighboring European countries such as Spain and Italy, while these death numbers were greater than those registered in other countries of central Africa or in countries closer to the Equator. Hence, independently of the vaccinations, for both the first and second years of the pandemic, it seems that climate factors, mainly warmer daily ambient temperatures, longer hours of sunshine, and higher levels of UV index in most African countries, could have played a key role in the low incidence of the coronavirus and COVID-19 disease. It should be expected that countries close to the Equator and those located in the lower latitudes will benefit from their special climate conditions to naturally fight future coronavirus pandemic. Although the exact mechanism to win the battle against the virus is still unknown, it is probably the higher temperature and UV light as a virucidal agent that may have interfered with the coronavirus and the pandemic's spread. Our results about UV index correlation with COVID-19 death could explain why some countries have recorded lower coronavirus incidence and less COVID-19 mortality [20-28].
It should be noted that many works have studied the possible effects of climatic factors on the incidence of COVID-19 and/or the mortality caused by the pandemic, in particular, the effect of ambient temperature [36-43]. Most of this work shows an inverse relationship between ambient temperature in a given country or region and the impact of COVID-19. The above works have focused on the regions of a single country or on several countries at the same time. It should also be noted that several studies have attempted to understand the involvement of other non-climatic factors [44, 45] on the degree of transmission of SARS-CoV-2, with the aim of better controlling the spread of the pandemic. In the present observational study, the strength part lies in the very significant statistical results of the negative correlation found between the incidence of mortality from COVID-19 and the three climatic parameters (temperature, hours of sunshine and UV index) in 39 countries on the planet. On the other hand, the weakness of the study could be the lack of more epidemiological and demographic data on the people who died in each country and were included in our study. Finally, according to our study, it seems that climatic factors could be intimately linked to the geographic latitude point of each country, and the data demonstrate that the position of a country at a given geographic latitude could be a key point in the distribution of the SARS-CoV-2 virus in the world. The geographic point of latitude would also be an important factor in the response of each population to the pandemic because this fact implies different dietary habits and epidemiological profiles that are also different from one population to another according to their geographic latitude location.
CONCLUSION
The data of the present study support the hypothesis that warmer ambient temperatures, longer hours of sunshine, and higher levels of UV index are favorable climate conditions for better protection against the coronavirus. As a virucidal factor, solar UV light might have a key role in this process. These results should encourage more preclinical and clinical studies on the possible role of UV light as an antiviral factor. Thus, it might unravel a possible therapeutic role of UV light, similar to other clinical use of UV light for other therapeutic purposes.
ETHICS APPROVAL AND CONSENT TO PARTICIPATE
Not applicable.
HUMAN AND ANIMAL RIGHTS
No animals and humans were used for studies that are the basis of this research.
CONSENT FOR PUBLICATION
Not applicable.
STANDARDS OF REPORTING
STROBE guidelines were followed in the study.
AVAILABILITY OF DATA AND MATERIALS
The data that support the findings of this study are available within the article.
FUNDING
No funding was obtained for the present research.
CONFLICT OF INTEREST
The author declares no conflict of interest, financial or otherwise.
AKNOWLEDGEMENTS
Declared none.