All published articles of this journal are available on ScienceDirect.

New UV Spectrophotometric Method for the Estimation of Molnupiravir used in the treatment of COVID-19
Abstract
Background:
Antiviral drugs gained more importance due to SARS-COV-2 infection and many drugs are under investigation to end the pandemic. Molnupiravir is an investigational medicinal product being developed by Merck Sharp and Dohme in collaboration with Ridgeback for the treatment of COVID-19.
Objective:
A new, simple, and economical UV-spectrometric method was developed and validated for the estimation of Molnupiravir in a bulk and pharmaceutical dosage form.
Methods:
The maximum wavelength was found to be 236 nm. The developed method was validated according to ICH guidelines and found to be linear within the range of 10-50µg/ml with a correlation coefficient (R2) 0.9989.
Results:
The %RSD for precision, accuracy, LOD, LOQ, Ruggedness, and Robustness were within the range of acceptable limits as per ICH Q2 (R1). The accuracy of the method was determined at three concentration levels and found to be 99.87%, 99.53%, and 99.84%.
Conclusion:
All parameters obtained are within acceptable limits as per ICH guidelines. The molnupiravir was exposed to thermal, photolytic, hydrolytic, and oxidative stress conditions and its stability data was determined which will be useful for further formulation development.
1. INTRODUCTION
The Molnupiravir, N-Hydroxy-51-0-isobutyryl-3, 4-dihydrocytidine (C2R, 3S, 4R, 5R)-3, 4-dihydroxy-5-((4Z)-4- (hydroxyimino)-2-oxo-3, 4-dihydropyrimidin-1(2H)-yl) oxolan-2-yl) methyl 2-methyl propanoate, was approved by UKS medicines and health product regulatory agency on 04 November 2021 and on 23 December 2021 was granted emergency use of authorization by FDA developed by Merck Sharp and Dohme in collaboration with Ridge back for treatment of COVID-19 [1]. An oral bioavailable isopropyl ester prodrug of the ribonucleoside analog -d-N 4-Hydroxycytidine (NHC, also known as EIDD-1931), molnupiravir (MPV), also known as EIDD-2801/MK-4482, has antiviral activity against several RNA viruses. With its active metabolite NHC showing broad-spectrum antiviral efficacy against SARS-CoV-2, MERS-CoV, SARS-CoV, and related zoonotic group 2b or 2c bat-CoVs, pharmacokinetic (PK) profiling revealed that MPV is orally bioavailable in ferrets and nonhuman primates. Additionally, it demonstrated improved effectiveness against CoV with mutations conferring resistance to the nucleoside analog inhibitor, Remdesivir. In mice models of SARS-CoV or MERS-CoV infection, prophylactic and therapeutic MPV treatment markedly improved pulmonary function, decreased viral titer, and prevented body weight loss [2]. An immunocompromised mouse model's response to molnupiravir treatment revealed suppression of SARS-CoV-2 replication in vivo, supporting the drug's potential for the treatment of COVID-19. Data from a phase 2a clinical trial presented at the 2021 Conference on Retroviruses and Opportunistic Infections (CROI) demonstrated that, in comparison to the placebo, treatment with molnupiravir significantly decreased the time to the negativity of infectious virus from nasopharyngeal swabs in COVID-19 participants [3].
Molnupriavir was recently approved for the treatment of COVID-19, there are no spectrophotometric methods available for this drug [2-14]. Therefore the new spectrophotometric method with forced degradation was developed and validated in bulk as well as in formulation for Molnupiravir.
2. MATERIALS AND METHODS
The Molnupiravir standard was provided by Swapnroop Research Pvt. Ltd., India. The Molnupiravir tablet containing 200 mg of Molnupiravir and the inactive ingredient used in the drug matrix was obtained from the market under the brand name “Molflu 200”. The analytical grade methanol was obtained from Merck life Science Pvt. Ltd. (Mumbai). The UV visible double beam spectrometer with matched quartz cells (1 cm) of Shimadzu with model no. 1800 was used for analysis.
2.1. Preparation of Standard Stock Solution
The accurately weighed 10mg Molnupiravir was transferred in a volumetric flask containing 10ml methanol to prepare 1000 µg/ml, and from that 100 µg/ml was prepared as a working standard.
2.2. Selection of Wavelength
The standard solution of Molnupiravir was scanned on a UV spectrophotometer between 200 nm to 400 nm on spectrum mode using diluents as blank. The Molnupiravir shows λmax at 236 nm (Fig. 1).

2.3. Method Validation
The new method was validated by following “Validation of Analytical procedures: Text and methodology Q2 (R1)”, guidelines given by the international conference on harmonization of technical requirements for registration of pharmaceuticals for human use. The objective of the analytical procedure will state different validation characteristics like linearity, precision, repeatability, intermediate precision, specificity, detection limit, quantitation limit, linearity, and range [15].
2.4. Linearity
Five points calibration curve was obtained in a concentration range from 10– 50 µg/ml for Molnupiravir. The response of the drug was found to be linear in concentration range and the linear regression equation was y = 0.042357x+0.123828 with a correlation coefficient of 0.9989. The results are shown in Table 1 and Fig. (2).
| Concentration (ppm) | Absorbance |
|---|---|
| 10 | 0.55148 |
| 20 | 0.96286 |
| 30 | 1.38023 |
| 40 | 1.85464 |
| 50 | 2.22342 |
| y-intercept | 0.12382 |
| Slope | 0.042357 |

2.5. Precision
The inter-day and intra-day precision of the method was determined at three concentration levels 10, 20, and 30 µg/ml. Three replicates of each concentration were determined, and the % RSD of found concentration was determined. The results are given in Tables (2-5).
2.6. Repeatability
The method's repeatability was determined by analyzing six replicates within short time intervals. The results are given in Table 6.
2.7. Accuracy
The accuracy of the method was determined by the standard addition method at 80%, 100%, and 120% concentration levels. The samples were analyzed on a UV spectrophotometer and the concentration found was compared with the found concentration standards of the same concentration. The percent recovery was obtained in the range of 99.87 – 99.84%. The results are shown in Table 7.
2.8. Robustness
The robustness of the method was determined by small but deliberate changes in wavelength and the drug was analyzed. The results of %RSD are given in Table 8.
| Concentration (ppm) | Absorbance | Found Concentration | % Found Concentration | Mean % Found Concentration |
|---|---|---|---|---|
| - | 0.55035 | 10.0 | 100 | - |
| 10 | 0.53998 | 9.815 | 98.15 | 98.796 |
| - | 0.54035 | 9.824 | 98.24 | - |
| - | 0.95947 | 19.709 | 98.545 | - |
| 20 | 0.94995 | 19.484 | 97.423 | 97.646 |
| - | 0.94613 | 19.394 | 96.972 | - |
| - | 1.36481 | 29.269 | 97.563 | - |
| 30 | 1.36951 | 29.379 | 97.93 | 98.001 |
| - | 1.37686 | 29.553 | 98.51 | - |
| - | - | - | Mean | 98.147 |
| - | - | - | SD | 0.588862 |
| - | - | - | %RSD | 0.599975 |
| Concentration (ppm) | Absorbance | Found Concentration | % Found Concentration | Mean % Found Concentration |
|---|---|---|---|---|
| - | 0.54293 | 9.885 | 98.85 | - |
| 10 | 0.53841 | 9.778 | 97.78 | 97.556 |
| - | 0.53101 | 9.604 | 96.04 | - |
| - | 0.94196 | 19.297 | 96.481 | - |
| 20 | 0.94996 | 19.484 | 97.424 | 96.911 |
| - | 0.94412 | 19.366 | 96.83 | - |
| - | 1.350 | 28.919 | 96.399 | - |
| 30 | 1.358 | 29.108 | 97.028 | 97.159 |
| - | 1.371 | 29.415 | 98.050 | - |
| - | - | - | Mean | 97.208 |
| - | - | - | SD | 0.325356 |
| - | - | - | %RSD | 0.3347 |
| Concentration (ppm) | Absorbance | Found Concentration | % Found Concentration | Mean % Found Concentration |
|---|---|---|---|---|
| - | 0.52774 | 9.5268 | 95.268 | - |
| 10 | 0.53680 | 9.7405 | 97.405 | 97.017 |
| - | 0.54093 | 9.8379 | 98.379 | - |
| - | 0.92998 | 19.0136 | 95.068 | - |
| 20 | 0.94948 | 19.4735 | 97.367 | 96.233 |
| - | 0.94012 | 19.2528 | 96.264 | - |
| - | 1.351 | 28.943 | 96.477 | - |
| 30 | 1.347 | 28.849 | 96.163 | 96.110 |
| - | 1.341 | 28.707 | 95.691 | - |
| - | - | - | Mean | 96.453 |
| - | - | - | SD | 0.492008 |
| - | - | - | %RSD | 0.5101 |
2.9. Ruggedness
The ruggedness of the method was analyzed by two different analysts at three concentration levels. The results are given in Tables 9 and 10.
Table 5.
| Concentration (ppm) | Absorbance | Found Concentration | % Found Concentration | Mean % Found Concentration |
|---|---|---|---|---|
| - | 0.54003 | 9.8107 | 98.167 | - |
| 10 | 0.53235 | 9.6356 | 96.356 | 95.218 |
| - | 0.52292 | 9.4132 | 94.132 | - |
| - | 0.94837 | 19.4474 | 97.237 | - |
| 20 | 0.94008 | 19.2518 | 96.259 | 96.176 |
| - | 0.92963 | 19.0066 | 95.033 | - |
| - | 1.349 | 28.896 | 96.320 | - |
| 30 | 1.341 | 28.849 | 96.163 | 96.032 |
| - | 1.340 | 28.683 | 95.613 | - |
| - | - | - | Mean | 95.8086 |
| - | - | - | SD | 0.09755 |
| - | - | - | %RSD | 0.1018 |
| Concentration (ppm) | Absorbance | Found Concentration | % Found Concentration |
|---|---|---|---|
| 30 | 1.38147 | 29.6914 | 98.971 |
| 30 | 1.37120 | 29.4490 | 98.163 |
| 30 | 1.36880 | 29.3923 | 97.974 |
| 30 | 1.36754 | 29.3626 | 97.875 |
| 30 | 1.35810 | 29.1397 | 97.132 |
| 30 | 1.35609 | 29.0922 | 96.974 |
| - | - | Mean | 97.843 |
| - | - | SD | 0.72849 |
| - | - | %RSD | 0.7445 |
|
% Recovery level |
Stock Solution of dosage form | API added | Concentration in ppm | Absorbance | Found Concentration | Conc. found in Std. API | % Recovery | Mean |
|---|---|---|---|---|---|---|---|---|
| 80% | 1 ml | 0.8 ml | 18 ppm | 0.881 | 17.85 | 17.86 | 99.97% | - |
| - | 1 ml | 0.8 ml | 18 ppm | 0.870 | 17.60 | 17.65 | 99.73% | 99.87% |
| - | 1 ml | 0.8 ml | 18 ppm | 0.850 | 17.13 | 17.14 | 99.91% | - |
| 100% | 1 ml | 1 ml | 20 ppm | 0.943 | 19.33 | 19.34 | 99.92% | - |
| - | 1 ml | 1 ml | 20 ppm | 0.947 | 19.43 | 19.49 | 99.68% | 99.53% |
| - | 1 ml | 1 ml | 20 ppm | 0.940 | 19.25 | 19.45 | 98.99% | - |
| 120% | 1 ml | 1.2 ml | 22 ppm | 1.041 | 21.65 | 21.74 | 99.57% | - |
| - | 1 ml | 1.2 ml | 22 ppm | 1.037 | 21.55 | 21.78 | 98.93% | 99.84% |
| - | 1 ml | 1.2 ml | 22 ppm | 1.048 | 21.80 | 21.58 | 101.03% | - |
|
Conc. µg/ml |
Absorbance | Found Concentration | % Found Concentration | Mean | ||||||
|---|---|---|---|---|---|---|---|---|---|---|
| R1 | R2 | R3 | R1 | R2 | R3 | R1 | R2 | R3 | ||
| 30 ppm (λ=236) | 1.361 | 1.351 | 1.359 | 29.208 | 28.972 | 29.160 | 97.36 | 96.57 | 97.20 | 97.04 |
| 30 ppm (λ=237) | 1.357 | 1.348 | 1.350 | 29.113 | 28.901 | 28.948 | 97.04 | 96.33 | 96.49 | 96.62 |
| 30 ppm (λ=238) | 1.350 | 1.345 | 1.349 | 28.948 | 28.830 | 28.924 | 96.49 | 96.47 | 96.47 | 96.35 |
| - | - | - | - | - | - | - | Mean | 96.671 | ||
| - | - | - | - | - | - | - | SD | 0.347707 | ||
| - | - | - | - | - | - | - | %RSD | 0.359680 | ||
| Concentration (ppm) | Absorbance | Found Concentration | % Found Concentration | Mean % Found Concentration |
|---|---|---|---|---|
| - | 0.55035 | 10.0 | 100 | - |
| 10 | 0.53998 | 9.815 | 98.15 | 98.796 |
| - | 0.54035 | 9.824 | 98.24 | - |
| - | 0.95947 | 19.709 | 98.545 | - |
| 20 | 0.94995 | 19.484 | 97.423 | 97.646 |
| - | 0.94613 | 19.394 | 96.972 | - |
| - | 1.36481 | 29.269 | 97.563 | - |
| 30 | 1.36951 | 29.379 | 97.93 | 98.001 |
| - | 1.37686 | 29.553 | 98.51 | - |
| - | - | - | Mean | 98.147 |
| - | - | - | SD | 0.588862 |
| - | - | - | %RSD | 0.599975 |
| Concentration (ppm) | Absorbance | Found Concentration | % Found Concentration | Mean % Found Concentration |
|---|---|---|---|---|
| - | 0.54011 | 9.827 | 98.27 | - |
| 10 | 0.55003 | 10.0 | 100 | 98.68 |
| - | 0.53797 | 9.777 | 97.77 | - |
| - | 0.95747 | 19.681 | 98.405 | - |
| 20 | 0.94981 | 19.500 | 97.500 | 97.61 |
| - | 0.94514 | 19.390 | 96.950 | - |
| - | 1.3671 | 29.352 | 97.84 | - |
| 30 | 1.3602 | 29.189 | 97.29 | 97.77 |
| - | 1.37155 | 29.457 | 98.19 | - |
| - | - | - | Mean | 98.02 |
| - | - | - | SD | 0.577148 |
| - | - | - | %RSD | 0.588806 |
2.10. Limit of Detection and Limit of Quantitation
2.11. Force Degradation Study
In the view of determining stability indicating data of the drug, the forced degradation was carried out by thermal, oxidative, acid, alkali, and photolytic degradation. The details of the procedure of forced degradation are given in the below sections [16-20].
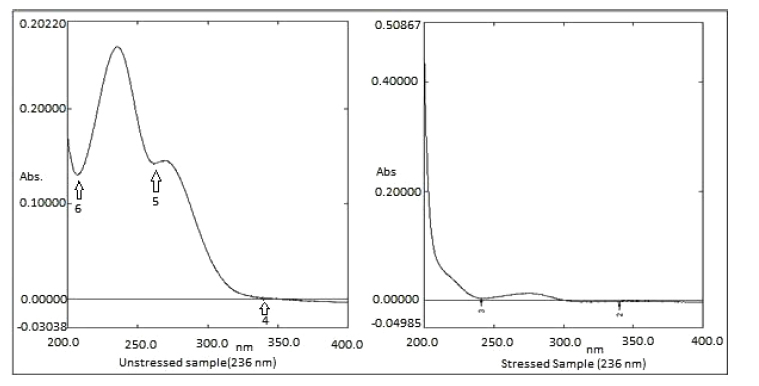
2.11.1. Thermal Degradation
The 0.5 ml of MLP standard stock solution was diluted to 4.5 ml of water, and then the solution was kept at 40oC for 2 hours. The solution was cooled to room temperature, and then it was diluted with a suitable solvent to 25 µg/ml and then absorbance was taken on UV spectrophotometry (Fig. 3).
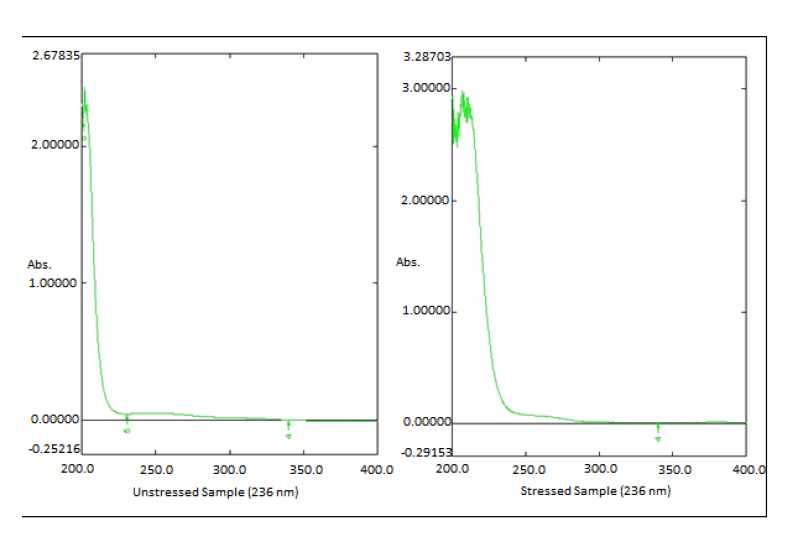
2.11.2. Oxidative Degradation
The 0.5 ml of MLP standard stock solution was diluted to 4.5 ml of 3% H2O2. Then the solution was kept at 40oC for 15 minutes. The solution was boiled at 100oC for 15 minutes and then cooled to room temperature. The solution was diluted with diluent to 25 µg/ml and then absorbance was taken on UV spectrophotometry (Fig. 4).

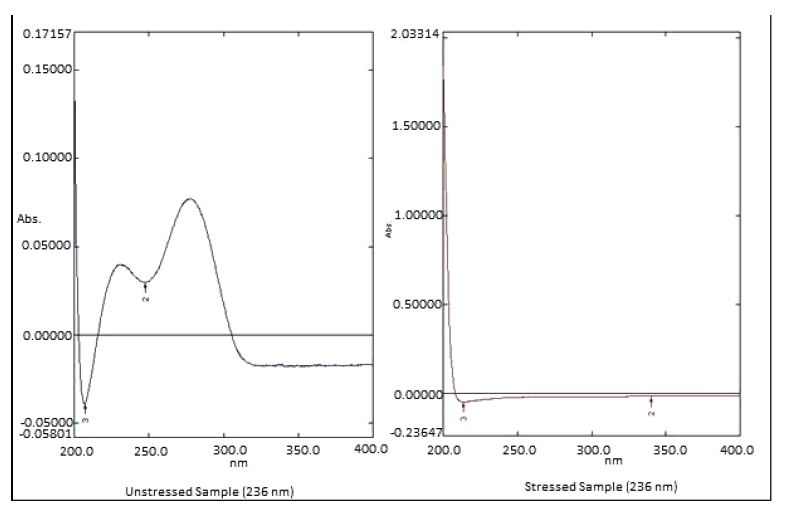
2.11.3. Acid and Alkali Hydrolysis
The 0.5 ml of MLP standard stock solution was diluted to 4.5 ml of 0.1M HCI or 0.1M NaOH. The solution was kept at 40oC for 2 hours. The solution was cooled at room temperature after they were neutralized with a suitable amount of HCI or NaOH. Then the solution was diluted with a suitable diluent to 25 µg/ml and then absorbance was taken on UV spectrophotometry (Figs. 5 and 6).
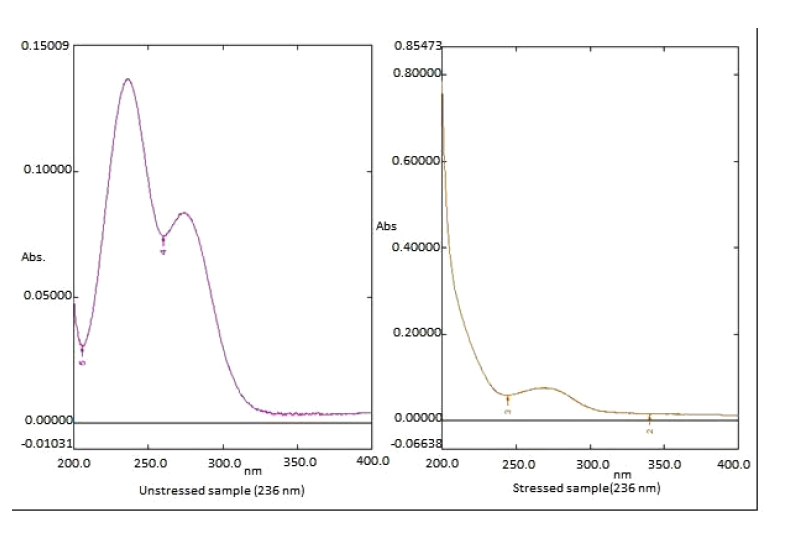
2.11.4. Photolytic Degradation
The 0.5 ml of MLP standard stock solution was diluted to 4.5 ml with water. The solution was kept under UV light combined with a tungsten lamp for 24 hours at room temperature diluent to 25µg/ml and then absorbance was taken on UV spectrophotometry (Fig. 7 and Table 11).
| Degradation Parameter | Absorbance of Unstressed Sample (236nm) | Absorbance of Stressed Sample (236nm) | % Degradation |
|---|---|---|---|
| Thermal Degradation | 0.26532 | 0.00679 | 2.559% |
| Oxidative Degradation | 0.33719 | 0.16051 | 47.602% |
| Acidic Degradation | 0.03770 | 0.02690 | 71.352% |
| Basic Degradation | 0.16367 | 0.04633 | 28.306% |
| Photolytic Degradation | 0.13666 | 0.6917 | 50.614% |
3. RESULTS AND DISCUSSION
The correlation coefficient of linearity shows that the method was linear over the range of 10-50 µg/ml. The %RSD for inter-day and intra-day precision and repeatability was found to be within the acceptable limit as per ICH Q2 (R1) guidelines. The accuracy of the method was determined at 80,100,120% levels and the results obtained were within the range of acceptable limit as per ICH Q2 (R1) guidelines. The %RSD for ruggedness and robustness were within the acceptable range as per ICH Q2 (R1) guidelines. The sensitivity of the method was determined by obtaining LOD and LOQ and their values obtained were within the acceptable limit as per ICH Q2 (R1) guidelines. The forced degradation behaviour of Molnupiravir was tried to determine and percent degradation in thermal, oxidative, acidic, basic, and photolytic degradation were reported, which are helpful for determining the stability indicating the method by using hyphenated techniques.
CONCLUSION
Since there is no method available for the determination of Molnupiravir by UV spectrophotometry, therefore in the present study, a new, simple, economical UV spectrophotometric method for determination of Molnupiravir in bulk and dosage form was developed and validated for the first time. The developed method was linear, accurate, precise, robust, rugged and having stability indicating characteristics that is capable of determining Molnupiravir in the presence of degradation products. The present analytical method was validated as per ICH Q2 (R1) guidelines and it meets specific acceptance criteria.
ETHICS APPROVAL AND CONSENT TO PARTICIPATE
Not applicable.
HUMAN AND ANIMAL RIGHTS
No humans/ animals were used for studies that are the basis of this research.
CONSENT FOR PUBLICATION
Not applicable.
AVAILABILITY OF DATA AND MATERIALS
The data and supportive information are available within the article.
FUNDING
None.
CONFLICT OF INTEREST
The authors declare no conflict of interest, financial or otherwise.
ACKNOWLEDGEMENTS
The authors are very much thankful to the Management and Principal, Dr.M.J.Chavan, of Amrutvahini College of Pharmacy, Sangamner for providing necessary facilities to carryout this work.