All published articles of this journal are available on ScienceDirect.

Exploring Patterns of Localized COVID-19 Spread Mitigation Measures that Affected Transportation Facilities
Abstract
Background:
Mitigation measures to lower the spread of COVID-19 have significantly impacted the transportation sector. However, the “shift-streets” measures aimed at providing space for social distancing have received less research attention.
Methodology:
This study used a text-mining approach to explore the content and spatial distribution of 1413 reported actions taken between 2020 and 2022. The focus was on the action type, purpose, infrastructure affected, coverage, longevity, and reason for triggering such a response.
Results:
It was observed that the United States had the highest number of reported mitigation measures. Most countries adopted shift-streets mitigation measures for moving people, public health, and economic recovery. Further, irrespective of the country, measures applied for the entire roadways and travel lanes were dominant on either one or more streets or the entire city. Developing countries performed reactive measures, while developed countries performed strategic measures.
Conclusion:
The study found a vast diversity of COVID-19 spread mitigation measures. The findings in this study can help city planners to understand the possible changes in mobility parameters in the post-COVID-19 era.
1. BACKGROUND
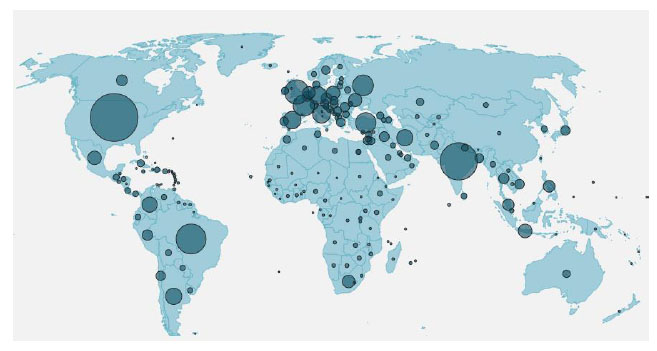
Since its first case was reported on December 8, 2019, in Wuhan, China [1], COVID-19 has evolved through multiple waves and spread all over the world. Currently, the world has witnessed over 320 million cases, and the United States, India, Brazil, the United Kingdom, and France (Fig. 1) are the top five countries with the largest number of cumulative total cases and total deaths [2, 3]. Other countries with significant cases and deaths include Russia, Turkey, Italy, Spain, Germany, and Argentina [2, 3].
In response to the eruption of COVID-19, countries instituted various mobility-related measures to limit its spread. Among the well-known mobility-related restrictions include travel restrictions and lockdowns. Most of the previous studies have evaluated the impacts of these mobility-related measures in terms of the changes in the traffic pattern, congestion, and crashes, among others [4-10]. Studies have found a great decline in vehicular traffic on roadways during the COVID-19 lockdown and travel restrictions, irrespective of trip purposes or locations [4-8]. Furthermore, studies reported changes in traffic crashes pattern during travel restrictions, whereby the total number of crashes declined significantly, but fatal crash rates increased significantly [9, 10].
Apart from travel restrictions and lockdowns, cities, jurisdictions, and neighborhoods established localized COVID-19 spread mitigation measures to provide spaces for safe, physically distanced walking, bicycling, and outdoor business. A study by Combs and Pardo (2021) is among the earliest studies that clearly depicted the localized measures adopted in various locations to lower the spread of COVID-19. Their study names these measures as “Shift-Streets”. Mainly these COVID-19 spread mitigation measures were adopted to provide more spaces for social distancing during walking, bicycling, and outdoor activities/business. However, transportation facilities paid higher prices to provide such spaces, whereby some roadways were closed, curbs were carved, and bike and parking lanes were changed to other outdoor uses.
Among the aspects of Shift-Streets, street reallocation has extensively received significant attention from researchers around the globe [11-17]. A study by Vecchio >et al., (2021) used the interview approach to evaluate the impact of street reallocation on active mobility in Latin America. The study found that the pandemic-related street reallocation helped to create cycle ways, pedestrian facilities, and other calming devices that would be otherwise difficult to be implemented without the pandemic initiative urgency. In Canada, a study by Fischer & Winters, (2021) explored the socio-spatial equity pattern of street reallocation during the COVID-19 pandemic. The study used data collected between April and August 2020 through websites and media. The study found that the reallocation was mainly due to supporting mobility, recreation, and social distancing. Furthermore, the reallocation tended to be in locations with few children and fewer minority and lower-income populations. Similarly, Wright & Reardon, (2021) evaluated whether street reallocation in Europe and North America benefited children’s health. Their study found that street reallocation tended to benefit children. Given such benefits to children, the study suggested that such reallocation should be extended along school routes so that children may have more space to play. In Seattle, Washington, and Vancouver, British Columbia, a study by Firth >et al., (2021) examined socio-spatial differences in access to street reallocations. The study found that street reallocations were dominant in Vancouver, where people use public transport or cycle to work and locations where recent immigrants were living. The study called for readdressing mobility inequalities through street reallocation. In another study, Shirgaokar >et al., (2021) used Twitter data to evaluate the response to street reallocation in the United States and Canada. The study found that using a curb for dining has opened the possibility of reimaging the innovative use of public spaces. On the other hand, a study by Mayo, (2021) evaluated the political factors around street reallocation decisions during the pandemic.
2. RESEARCH GAP AND OBJECTIVE
The literature review indicates that travel restrictions and lockdowns are well-explored topics. Further, street reallocation received significant attention from researchers among the “shift streets” COVID-19 spread mitigation measures, which intended to provide more space for social distancing while performing normal activities. However, less is known about other mitigation measures undertaken to provide space for social distancing while walking, biking, or doing commerce activities. Apart from the content and spatial distribution of these mitigation measures, their relationship with the trend of COVID-19 cases has not been well explored. Therefore, this study intends to explore the spatial distribution of the COVID-19 spread mitigation measures. The focus of this study is on the spatial distribution of the actions taken, the purpose of the strategy, the specific infrastructure affected by the strategy, the spatial coverage of the strategy, anticipated longevity, and the reason for triggering such a strategy. These attributes are then associated with the trends of COVID-19 across the globe to understand the correlation between COVID-19 spread mitigation measures and the spread of COVID-19 cases. The remainder of the manuscript is organized as follows. The next section presents the methodology, which covers data description and analysis approaches, followed by results and discussion. Lastly, the conclusion and future studies are presented.
3. METHODOLOGY
This study applied text network analysis (TNA) on the “Street shift” data collected and curated by Combs & Pardo, (2021). This section presents the details of the applied methodology, and the data description is first presented to aid in understanding the methodology.
3.1. Data Description
The shifting streets dataset, which contains over 1400 actions taken by 509 cities in 59 countries, was collected and curated by Combs & Pardo, (2021) between Mar 1, 2020, and Jan 13, 2022. This data was collected due to requests for first-hand information distributed through social media, webinars, data swaps, transportation planners, and other researchers who have documented pandemic-related mobility responses. Most of the data were drawn from the local actions to support walking and cycling during the social distancing dataset. The COVID-19 Livable streets Response complemented these dataOVID-19 spread mitigation measures dataset, and the COVID Mobility Works dataset [18-20]. More details about data collection can be found in the study by Combs & Pardo, (2021).
Table 1.
| Country | Frequency of Responses | Rank | Total Cases | Total Cases Ranking | Total Cases/mil | Total Cases/ Mil Ranking |
|
|---|---|---|---|---|---|---|---|
| United States | 681 | 1 | 71,135,783 | 1 | 212,972 | 11 | |
| United Kingdom | 136 | 2 | 15,709,059 | 5 | 229,533 | 4 | |
| Canada | 105 | 3 | 2,882,020 | 19 | 75,336 | 36 | |
| France | 54 | 4 | 16,001,498 | 4 | 244,306 | 2 | |
| Australia | 43 | 5 | 2,090,810 | 26 | 80,543 | 34 | |
| Spain | 33 | 6 | 8,975,458 | 9 | 191,853 | 13 | |
| Netherlands | 33 | 7 | 3,778,287 | 16 | 219,748 | 8 | |
| Colombia | 22 | 8 | 5,686,065 | 12 | 109,931 | 26 | |
| Belgium | 22 | 9 | 2,642,761 | 22 | 226,499 | 5 | |
| Portugal | 22 | 10 | 2,118,125 | 25 | 208,671 | 12 | |
| Germany | 20 | 11 | 8,535,962 | 10 | 101,378 | 30 | |
| Argentina | 19 | 12 | 7,694,506 | 11 | 167,859 | 16 | |
| Italy | 19 | 13 | 9,597,362 | 8 | 159,097 | 19 | |
| Philippines | 17 | 14 | 3,357,083 | 18 | 30,016 | 44 | |
| India | 14 | 15 | 38,901,485 | 2 | 27,766 | 45 | |
| New Zealand | 14 | 16 | 15,401 | 55 | 3,079 | 53 | |
| Ireland | 12 | 17 | 1,134,548 | 36 | 225,855 | 6 | |
| Mexico | 10 | 18 | 4,545,683 | 13 | 34,691 | 43 | |
| Israel | 10 | 19 | 2,168,016 | 23 | 232,470 | 3 | |
| Peru | 8 | 20 | 2,780,049 | 20 | 82,533 | 33 | |
Table 1 presents the summary statistics of the COVID-19 spread mitigation measures and COVID-19 cases. The table shows the frequency of responses to the reported measures, total cases per million population, and their associated country rankings. The total cases/mil ranking shows the total cases per million population, which is computed as the total number of cases divided by the country’s population. The larger the number, the higher the ranking. It can be observed that the United States has the highest number of responses to reported incidents/measures (681) as well as the highest number of total COVID-19 cases. However, it is ranked 11th regarding the number of COVID-19 cases per million population.
Conversely, countries like India and Italy are ranked lower for several reported mitigation measures but higher for the number of total COVID-19 cases. On the other hand, Israel and Ireland are highly ranked on some COVID-19 cases per million population criteria, but lower ranked in the total number of COVID-19 cases and the number of reported mitigation measures. This observation can be attributed to the fact that the data collection activities utilized online tools and were organized by people from the United States. These people might have more connections with people in the United States than in other countries. Therefore, they are more likely to get more information related to these COVID-19 spread mitigation measures from the United States than other countries
The dataset contains several variables; however, to perform spatial-content analysis, this study focused on six key variables, which are
i. The primary action type. This is the high-level categorization of action types. It includes full and partial street closures, curbs space allocations, reallocation of non-street spaces, automatic walk signals, legal, policy, enforcement, funding changes, and other mobility-related strategies.
ii. Purpose of response. These strategies entail the aim of the action taken, which include economic recovery, equity, moving goods, moving people, public engagement, safety, public health, and others.
iii. Specific infrastructure affected depicts the physical infrastructure affected by the action, when applicable. It includes the beg buttons, road space (including bridges), sidewalk, cycling lane, stop lights, pedestrian overpasses, and removal of two or more infrastructure elements.
iv. Spatial coverage is the geographic scope of the implementation of the action as described in the source or by contact. The spatial coverage includes one or more streets, one or more neighborhoods, one city borough or equivalent, the entire city, metropolitan area or county, state, country, and multi-country.
v. Anticipated longevity, is the expected duration of the response/action. The strategies include one-time implementation, temporary, permanent, temp-to-perm, and indefinite.
vi. Reasons to trigger such a response. The four reasons listed are anticipated response, reactive response (to higher contagion), strategic response (to fast-track previous policies), and opening up after lockdown.
vii. Country where the response took place.
The country where the response took place was added to each variable (i) through (vi). The new variable had the country name and the description of either type, purpose, infrastructure, coverage, longevity, or reason to trigger the responses. The newly created variables were then used in text mining to explore the patterns. Furthermore, text mining was used for the selected variables to explore the patterns of description of the COVID-19 spread mitigation measures undertaken.
3.2. Data Analysis Approach
As stated earlier, this study applies TNA to understand the spatial distribution of the COVID-19 spread mitigation measures. TNA is a relatively recent approach used to analyze text data. It uses nodes and arcs to represent keywords and the co-occurrence of the keywords in the network [21-23]. The added advantage of the text network is the ability to visualize the interconnectedness between keywords and the alignment of the topics [22, 24].
In the context of this study, a text network facilitates the easy connection between the content of the variable of interest and the country where such action took place. Traditionally, Geographical Information System (GIS) would have been applied to associate such variables and the countries. However, GIS cannot clearly show the interconnectedness between countries and the content of the interest, especially when multiple countries share the same strategy or vice versa. Further, applying GIS would result in numerous figures for the same sub-objective, considering the scatteredness of the countries in this study.
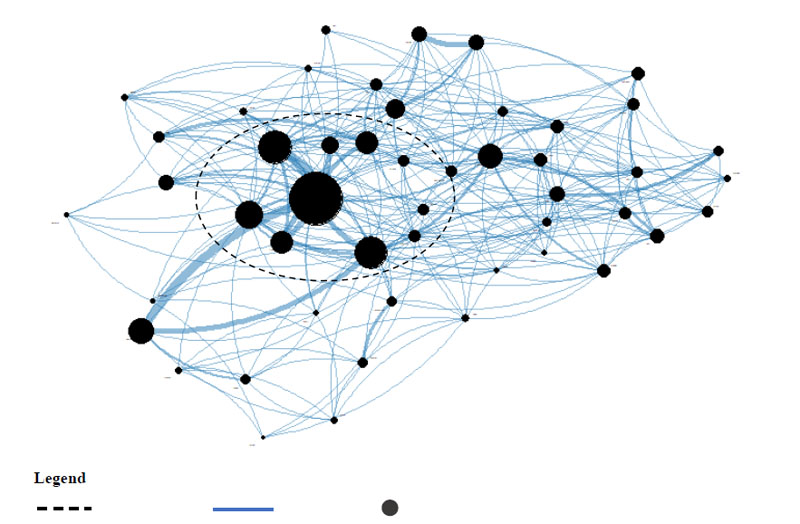
To create a text network, preliminary universal steps for text mining, such as text normalization and the creation of structured data from unstructured ones, are performed. Normalization involves the removal of stop words and putting all text in lower case (except for country names). Conversion from unstructured to structured data involves the creation of a matrix of keywords with their frequencies and co-occurrences. The matrix is then used to map the keywords in a network. The first pair of keywords are mapped, then if there is another pair of keywords with one of the keywords matching the previous pair, that common keyword is added to the previous network, but a new link is formed to create another pair. This repetitive process is performed until all the keywords are mapped [21, 22, 25]. Keywords with high frequency in the matrix will have large nodes in the network (Fig. 2).
Similarly, pairs of keywords with high frequency in the matrix will have a thick link in the network. Furthermore, the closer the keywords are in the network, the closer they are to the actual text [21, 24, 27].
Using the text network, various parameters can be deduced. First, the network provides the patterns of the keywords which form a community. Most of the time the community represents the keywords of a similar theme. Additionally, the frequency of the co-occurred keywords provides more insights than the frequency. Collocated keywords, which are similar to co-occurred keywords, but are located next to one another, provide even richer insights. In this study, only the top 50 keywords for each network were considered [24, 28]. This was performed to avoid a clogged network that can be hard to interpret. The discussions of the results are based on the topology of the network, main keywords, co-occurred keywords, and collocated keywords.
4. RESULTS AND DISCUSSION
This section presents the results and a discussion of the findings. It covers the text network results for the primary actions type, the purpose of the strategy, the infrastructure affected, coverage of the strategy, longevity, and reason to trigger the strategy. The spatial distribution of such COVID-19 spread mitigation measures and the association with the trend of COVID-19 cases are presented.
4.1. Primary Action Type
The primary action type represents the high-level categorization of the actions taken to reduce the spread of COVID-19. Primarily, six major actions were taken: curb space reallocation, full street closure, partial street closure, other mobility-related COVID-19 spread mitigation measures, legal policy enforcement funding (LPEF) changes, and changes in automated walk signals. Fig. (3) presents the spatial distribution of the primary actions taken to reduce the spread of COVID-19.
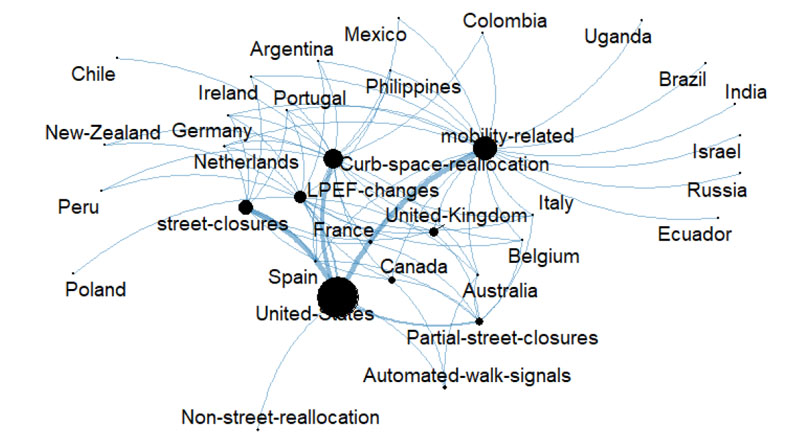
The size of the nodes in Fig. (3) suggests that most of the mitigation measures were other mobility-related, followed by curb space reallocation, full street closure, and LPEF changes. In contrast, partial street closure and automated walk signal changes had a relatively low frequency.
The United States dominated the network, applying almost all six mitigation measures. However, the size of the links suggests that other mobility-related, curb space reallocation, and full street closure were the three dominant mitigation measures in the United States. Other countries with multiple documented actions include Germany, Ireland, Portugal, Argentina, the Philippines, the United Kingdom, France, and Peru. Most of these countries are among the top ten countries with more COVID-19 cases per million population (2). France, the United Kingdom, and Ireland are ranked second, fourth and sixth in terms of the number of cases per million population. On the other hand, countries with a single documented strategy include Chile, Poland, Uganda, Brazil, India, Russia, and Ecuador. Further, only United States, Canada, and Australia prioritized changes in automated walk signals at the intersections. The partial street closures cluster also shows that the measure was performed in the United States, Canada, the United Kingdom, Australia, France, Belgium, and Italy. The curb space allocation was featured in several countries, including Mexico, Portugal, German, and the Netherlands, but was not featured in Uganda, Brazil, India, Ecuador, Israel, and India. Full street closures were performed in a relatively small number of countries. These include the Netherlands, German, Ireland, Portugal, Spain, France, and the United Kingdom. The LPEF changes were observed in multiple countries. Most of these countries were where the full street closures were performed.
4.2. Purpose of the Strategy
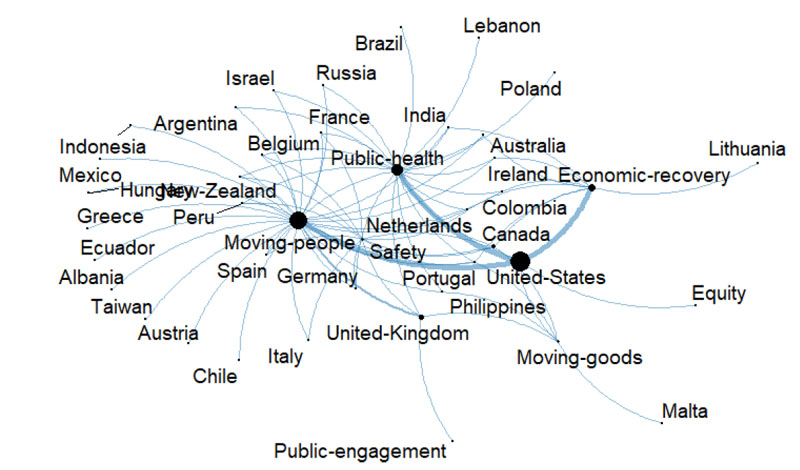
The purpose of the COVID-19 spread mitigation measures is to apply different mitigation measures in different nations to prevent the spread of COVID-19. These mitigation measures were taken for six major purposes, including protecting moving people, maintaining public health, ensuring economic recovery, ensuring safety in the community, allowing the moving goods, and increasing public engagement in different activities.
Fig. (4) represents the network for mitigation measures applied by different countries. The size of the nodes suggests that moving people and maintaining public health were the main purposes for these mitigation measures across several countries. The economic recovery was mainly applied by the United States, Australia, India, Ireland, Columbia, Canada, and Lithuania, as indicated by the cluster of countries connected to the economic recovery node. A few counties applied these mitigation measures for moving goods and public engagement.
Furthermore, the United States dominates the network implying that the nation has six main purposes for applying the mitigation measures for the prevention of COVID-19. In addition to economic recovery, the size of the links suggests that the United States applied the mitigation measures mainly for moving people and the public. As shown in Fig. (4), countries with multiple purposes include the United States, United Kingdom, India, Belgium, Portugal, France, Canada, Australia, and the Netherlands. Countries that applied the mitigation measures for moving people only include Chile, Taiwan, Greece, Indonesia, and Albania. Conversely, countries that applied mitigation measures only for maintaining public health include Poland, Brazil, and Albania. Overall, there is a pattern regarding the countries that applied mitigation measures for public health. It can be observed that these countries are also ranked higher in terms of the number of COVID-19 cases (2). The observation suggests that the COVID-19 spread mitigation measures were applied after the widespread COVID-19 cases.
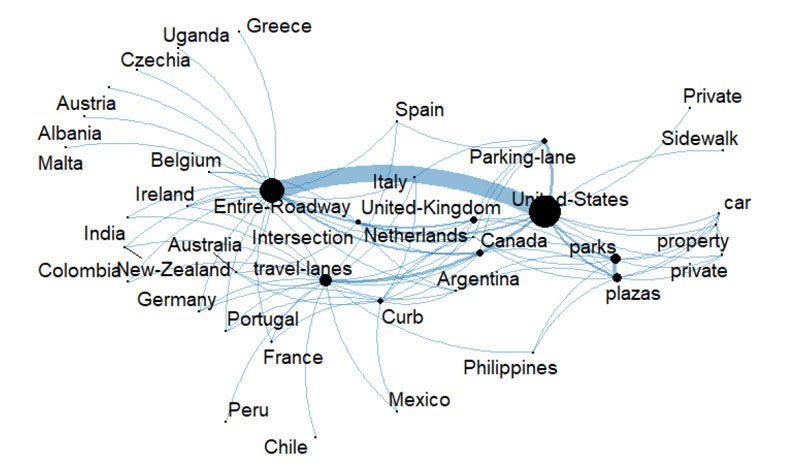
4.3. Infrastructure Affected
Fig. (5) presents the infrastructure affected by the strategy. The sizes of the nodes suggest that most of the mitigation measures affected the entire roadway, followed by travel lanes, parking lanes, plazas/parks, intersections, and curbs. Similar to the previous findings, the United States appears to have multiple mitigation measures, but mitigation measures that affect the entire roadway are dominant. The same country has a strong link with parking lanes, suggesting that mitigation measures in the United States focused on utilizing the parking lanes. The parking lanes were also affected in the United Kingdom, Canada, Spain, Italy, and the Netherlands. On the other hand, the link between travel lanes and Canada is thick, suggesting that Canada has several COVID-19 spread mitigation measures that impacted travel lanes. Several other countries, including the Philippines, India, Germany, Portugal, and France, had mitigation measures that affected multiple infrastructures. Conversely, countries like Greece, Uganda, Austria, Albania, Malta, Chile, and Peru had COVID-19 spread mitigation measures that affected only one infrastructure: either the entire roadway or travel lanes.
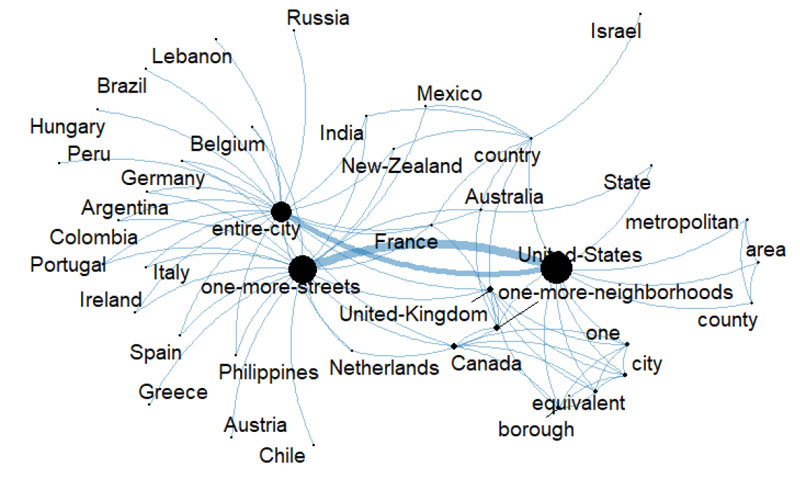
4.4. Strategy’s Coverage Extent
Fig. (6) presents the coverage extent of COVID-19 spread mitigation measures, whereby most of the mitigation measures covered one or more streets, while others covered the entire city, and a few covered one or more neighborhoods, a metropolitan area, a State, or an entire country. COVID-19 spread mitigation measures in the United States were likely to cover either three or more streets or an entire city. This is deduced from the link between the United States and both the entire city and one or more streets. On the other hand, a few US-based COVID-19 spread mitigation measures covered either the entire country, State, or one or more neighborhoods.
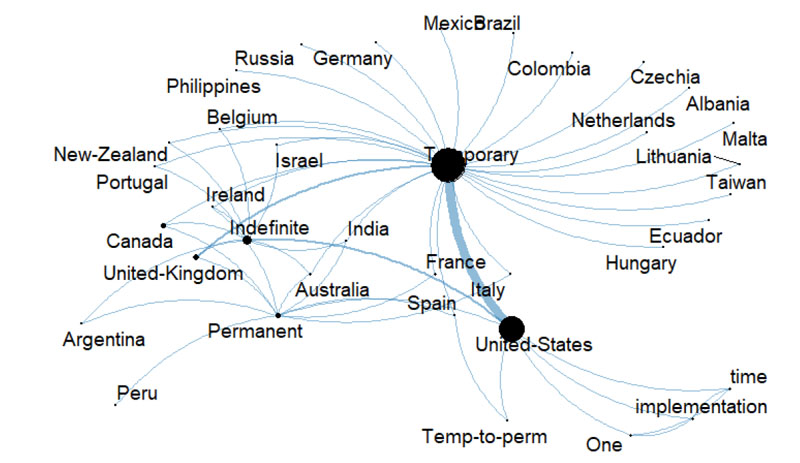
4.5. Strategy’s Anticipated Longevity
Fig. (7) presents the length of time the strategy is planned for. This includes permanent, indefinite, temporary, and one-time applications. The figure shows a pattern where permanent and indefinite COVID-19 spread mitigation measures form one cluster, which is separate from the temporary cluster. As expected, Fig. (7) shows that most mitigation measures were temporary. The United States had not only the largest number of temporary mitigation measures but also the largest number of mitigation measures that were indefinite and permanent. The same country had some mitigation measures for one-time implementation and temporary to permanent. Of interest would be COVID-19 spread mitigation measures that are either indefinite or permanent. Fig. (7) shows that permanent COVID-19 spread mitigation measures were dominant in Spain, India, Australia, Peru, Argentina, the United Kingdom, France, Canada, and Italy. These are among the countries that had the largest number of COVID-19 cases. For instance, India has the highest number of total cases (37.38 million followed by the United Kingdom, France, Italy, Spain, Argentina, Canada, and Peru [2]. Further, India is leading with the highest number of deaths, followed by Peru, the United Kingdom, Italy, France, Argentina, Spain, Canada, and Australia. Similarly, the indefinite COVID-19 spread mitigation measures were dominant in Israel, Belgium, New Zealand, the United States, Argentina, Canada, and Ireland.
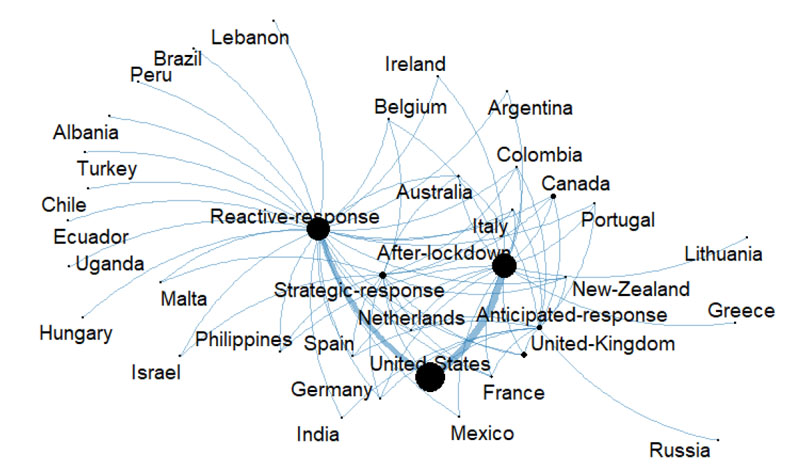
4.6. Reason for Triggering the Strategy
Fig. (8) presents the reasons for triggering the strategy. It can be observed that four key reasons are described, which are reactive responses, anticipated responses, strategic responses, and after-lockdown reasons. Among the reasons, most countries focused on reactive and after-lockdown responses. Similar to the previous COVID-19 spread mitigation measures, the United States has more documented reasons, regardless of the reason. Further, most countries had more than one reason to trigger the responses. Countries that had single reasons, including Brazil, Lebanon, Turkey, Chile, Ecuador, Uganda, and Hungary, focused on reactive responses. On the other hand, Lithuania and Greece focused on after-lockdown-only responses and have a relatively lower number of COVID-19 cases (2). The observation suggests that these countries had a lower number of COVID-19 cases; thus, they didn’t need to perform strategic responses. The size of the after-lockdown mitigation measures’ node suggests that these COVID-19 spread mitigation measures were the second most triggered behind the reactive responses. A significant number of links are connected to this strategy, which implies that several countries triggered it. Countries whose mitigation measures were triggered by the anticipated responses were also likely to trigger strategic responses. These countries include Canada, New Zealand, Columbia, the United Kingdom, the Netherlands, and Spain.
CONCLUSION
This study analyzed COVID-19 Livable Streets Response COVID-19 spread mitigation measures through text mining to understand the spatial distribution of COVID-19 responses that affected transportation facilities. The study focused on the primary action type, purpose of response, specific infrastructure affected, spatial coverage, whether the strategy was permanent or temporary, and the reasons for triggering such a response. The results revealed that there is a spatial variation in the responses across different countries. The United States was the leading country in almost all aspects, as it had a higher frequency of each response. Apart from the United States, there observed different patterns. Several countries, such as Germany, Ireland, Portugal, Argentina, Philippines, United Kingdom, and France, had Curb space reallocation as the primary action type, while Uganda, Brazil, India, Russia, and Ecuador had other mobility-related as the primary action type. Most developing countries performed reactive responses, while developed countries performed strategic responses. A relatively small number of countries had permanent COVID-19 spread mitigation measures.
This study revealed that the COVID-19 spread mitigation measures were made for three main purposes: protecting moving people, maintaining public health, and economic recovery. Also, maintaining the community’s safety was the target of many counties in the world. On the other hand, few counties applied mitigation measures to protect the moving goods and prevent public engagement. Many purposes of the mitigation measures were mobility-related in one way or another. The mitigation measures have been shown to affect the infrastructures, including the entire roadway, travel lanes, parking lanes, plazas/parks, intersections, and curbs. The parking lanes were affected in many countries, including the United States, United Kingdom, Canada, Spain, Italy, and the Netherlands. On the other hand, countries like Greece, Uganda, Austria, Albania, Malta, Chile, and Peru had mitigation measures that affected only one infrastructure: either the entire roadway or travel lanes.
The United States had not only the largest number of temporary COVID-19 spread mitigation measures but also the largest number of mitigation measures that were indefinite and permanent. Other countries with temporary mitigation measures include Brazil, Mexico, Colombia, Albania, Ecuador, Hungary, Germany, and Russia. In the case of the reasons anticipated by different countries, it was revealed that most countries focused on reactive and after-lockdown responses. Also, most of the countries had more than one reason to trigger the responses. Countries that had single reasons, including Brazil, Lebanon, Turkey, Chile, Ecuador, Uganda, and Hungary, focused on reactive responses. On the other hand, Lithuania and Greece focused on only responses after the lockdown.
Although this study provided various insights into the responses that affected transportation facilities, it has several limitations that can be improved in future studies. First, not all countries are represented in the responses. For instance, South Africa and China were heavily impacted by COVID-19, but the COVID-19 spread mitigation measures are rarely reported in the dataset. Further, the current dataset is heavily aligned with data from the United States. As a future scope of this study, countries that are rarely reported can be explored from different data sources. Additionally, this study did not evaluate the relationship between the measures applied and their effectiveness. Future studies may consider this aspect.
Nevertheless, the results of this study will allow transport authorities and planners to become aware of and respond to responses raised by the communities in different countries. These findings are crucial to transportation planners and engineers to predict the possible changes in infrastructure design and operations during the post-COVID-19 era. Also, the outcomes will assist in understanding the impacts of COVID-19 on transport mobility, identifying effective reopening of COVID-19 spread mitigation measures, and comprehending the future potentials of those COVID-19 spread mitigation measures.
LIST OF ABBREVIATIONS
| TNA | = Text network analysis |
| LPEF | = Legal Policy Enforcement Funding |
ETHICS APPROVAL AND CONSENT TO PARTICIPATE
Not applicable.
HUMAN AND ANIMAL RIGHTS
No animals and humans were used in this research.
CONSENT FOR PUBLICATION
Not applicable.
AVAILABILITY OF DATA AND MATERIALS
The data supporting the findings of the article is available at https://www.covidmobilityworks.org/find-responses.
FUNDING
None.
CONFLICT OF INTEREST
The authors declare no conflict of interest, financial or otherwise.
ACKNOWLEDGEMENTS
The authors would like to thank Dr. Tabitha S. Combs of the University of North Carolina at Chapel Hill and her team for collecting and archiving Shifting streets COVID-19 mobility data. This dataset has been instrumental for this study and for more to come.